User analytics is the key to unlocking valuable insights about user behavior, preferences, and interactions. In today's data-driven world, businesses across countless industries rely on user analytics to make informed decisions, optimize user experiences, and drive growth.
From e-commerce to mobile apps and content websites, user behavior analytics provides a wealth of data that empowers organizations to understand their users better and deliver exceptional products and services.
In this article, we’ll explore the concept of user analytics, its importance, and the various ways it’s applied in different domains.
By delving into the world of user analytics, businesses can gain a competitive edge, increase customer satisfaction, and achieve their goals in a rapidly evolving digital landscape.
What Is User Analytics?
User analytics is the process of gathering, analyzing, and interpreting data about user behavior to gain insights into their preferences, actions, and needs.
It involves tracking several metrics, such as website visits, clicks, time spent on pages, and conversions to understand how users interact with a product or service.
 Source: YouTube
By focusing on key metrics with user behavior analytics, businesses can answer important questions like:
- How are users finding their website?
- Which features are they using the most?
- Where are they dropping off in the conversion funnel?
These insights help companies make data-driven decisions to enhance the user experience, optimize marketing strategies, and ultimately, drive business growth.
By studying active users, businesses can identify patterns and trends, enabling them to make informed improvements to their products, services, and marketing campaigns.
They can uncover pain points, understand user preferences, and personalize experiences for individual users to better cater to their target audience.
Embedded analytics also provides valuable user feedback that guides decision-making, helping companies stay ahead of the competition and deliver exceptional user experiences.
In summary, user behavior analytics is an essential tool for businesses to gain a deeper understanding of the user journey, make data-backed decisions, and continuously improve their offerings to meet user expectations in an ever-evolving digital landscape.
Types of User Analytics
Segment Analytics
One use case is segment analytics, which is the process of dividing users into distinct groups based on specific characteristics or behaviors.
By analyzing these segments separately, businesses can gain deeper insights into different user groups' unique needs and preferences.
This allows for more targeted and personalized marketing efforts, as well as tailored product enhancements.
Segment analytics helps businesses identify high-value customer segments, understand their behaviors, and create strategies to engage and retain them.
By focusing on specific segments with their metrics, businesses can allocate resources more efficiently, optimize conversion rates, and deliver customized experiences that resonate with their audience.
Funnel Analytics
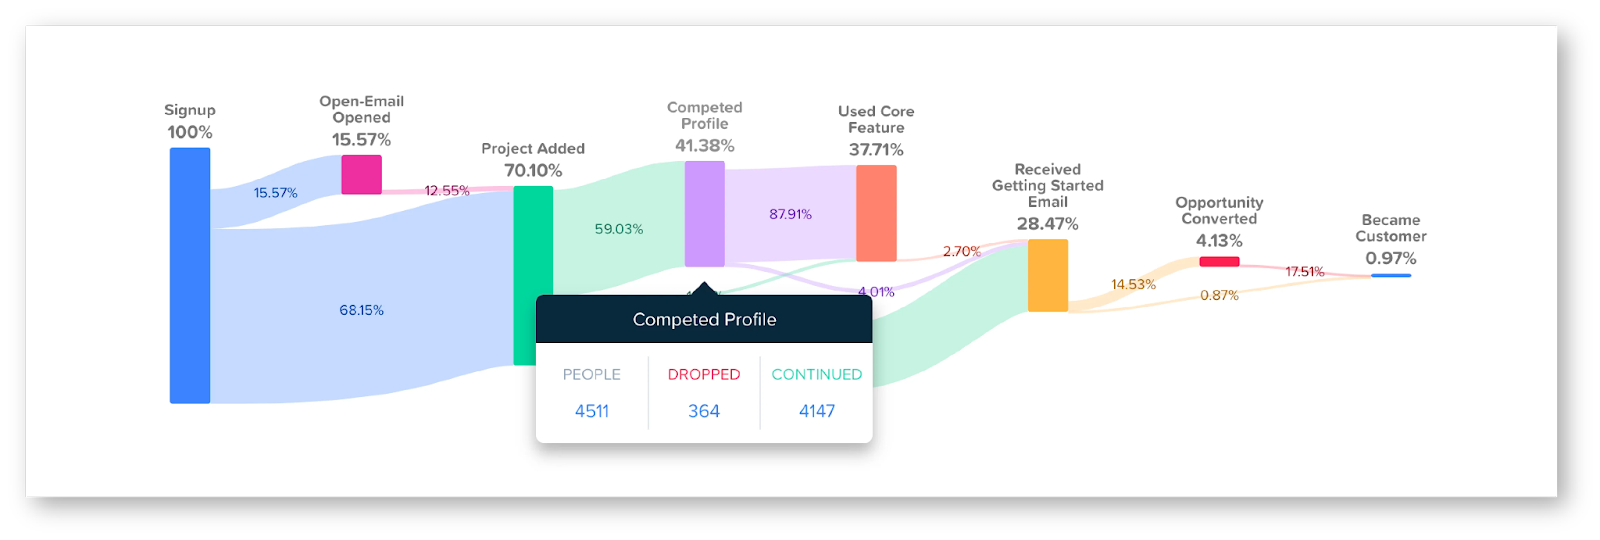
Funnel analytics involves tracking user behavior across various stages of a conversion funnel, from initial awareness to final purchase or sign-up.
It provides a visual representation of the user journey and highlights potential bottlenecks or drop-off points.

By analyzing funnel analytics, businesses can identify areas where users are getting stuck or losing interest, allowing them to optimize those specific steps and improve conversion rates.
Funnel analytics also helps companies measure the effectiveness of their marketing campaigns, identify opportunities for optimization, and drive continuous refinement in the conversion process.
Besides that, it enables businesses to pinpoint areas of improvement and implement targeted strategies to maximize conversions and revenue.
Cohort Analytics
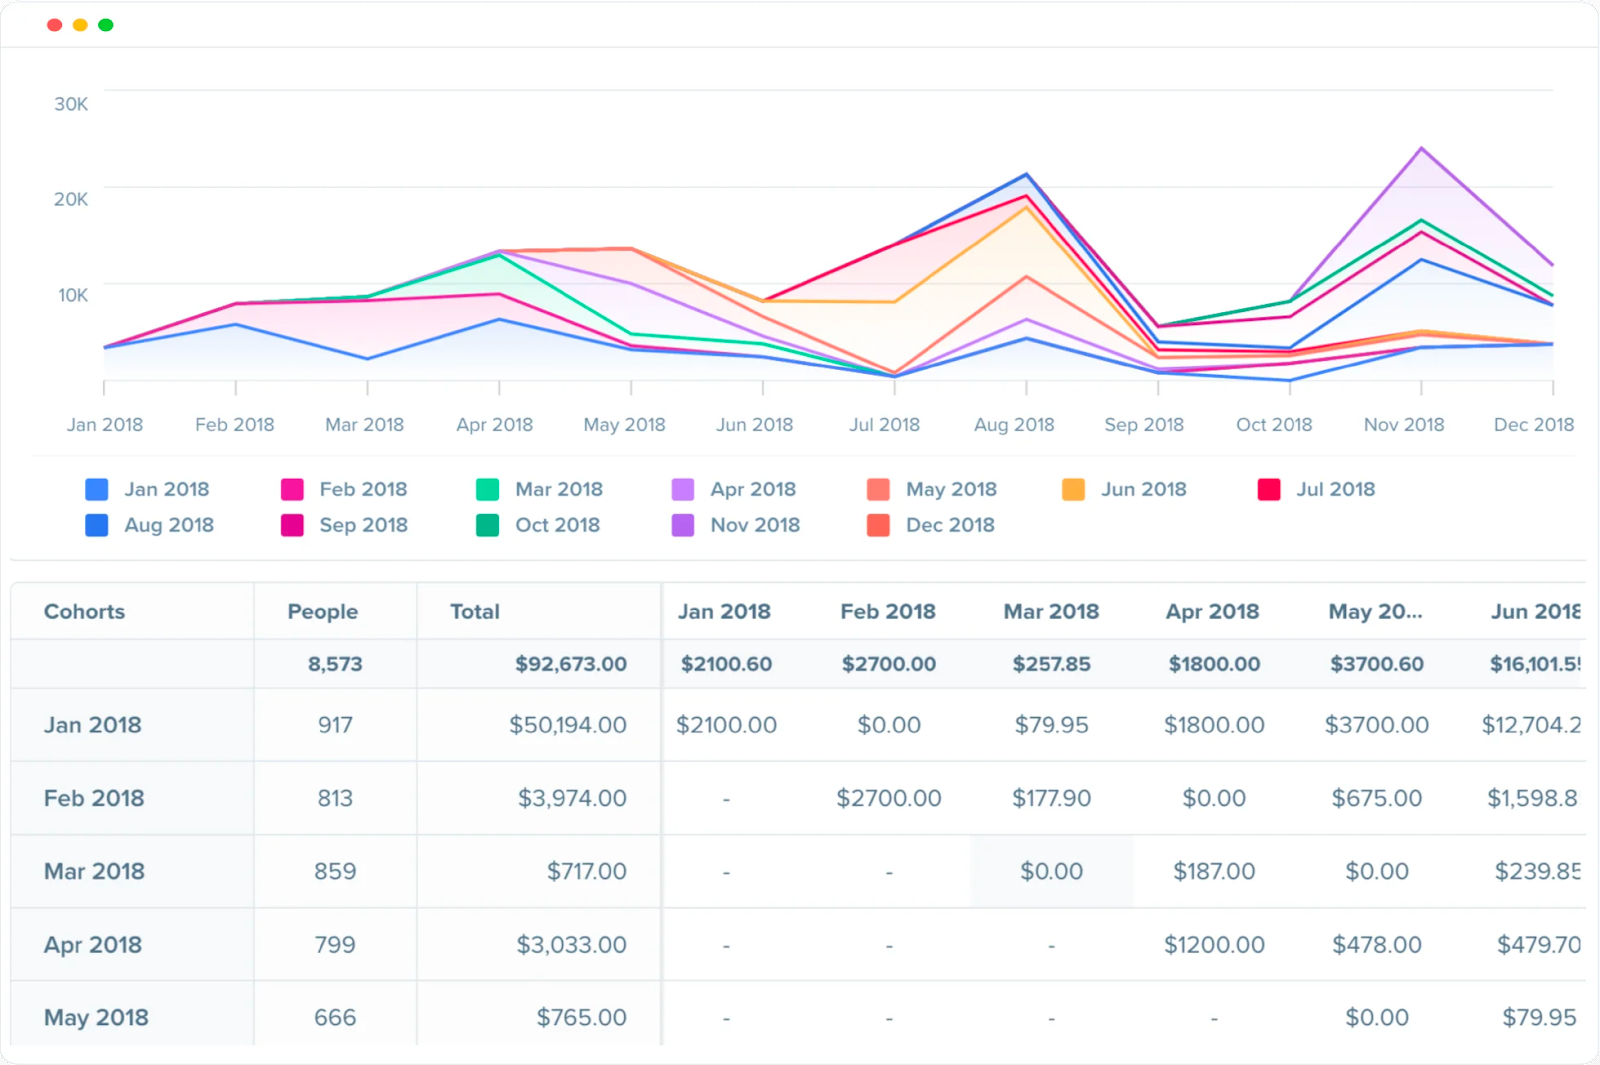
Cohort analytics involves grouping users based on shared characteristics or experiences within a specific time frame.
It allows businesses to track and compare the behavior and performance of different user cohorts over time.

By analyzing cohort data, companies can understand how user engagement, retention, and revenue metrics vary across different groups.
Cohort analytics helps businesses uncover valuable insights into the long-term impact of their marketing efforts, product updates, or other initiatives.
It enables businesses to measure the effectiveness of specific strategies and identify trends or patterns that can inform future decision-making.
By studying cohort analytics, companies can make data-driven decisions to optimize user experiences, increase customer loyalty, and drive sustainable growth.
What Are User Analytics Tools?
User analytics tools are powerful software applications designed to collect, analyze, and visualize data related to user behavior and interactions.
These tools offer businesses the ability to gain deeper insights into their user base and make smart decisions based on data-driven metrics.
User analytics tools provide features such as machine learning, data tracking, user segmentation, funnel analysis, and cohort analysis.
They gather data from various sources like websites, mobile apps, and other digital platforms, allowing businesses to monitor user activity in real-time.
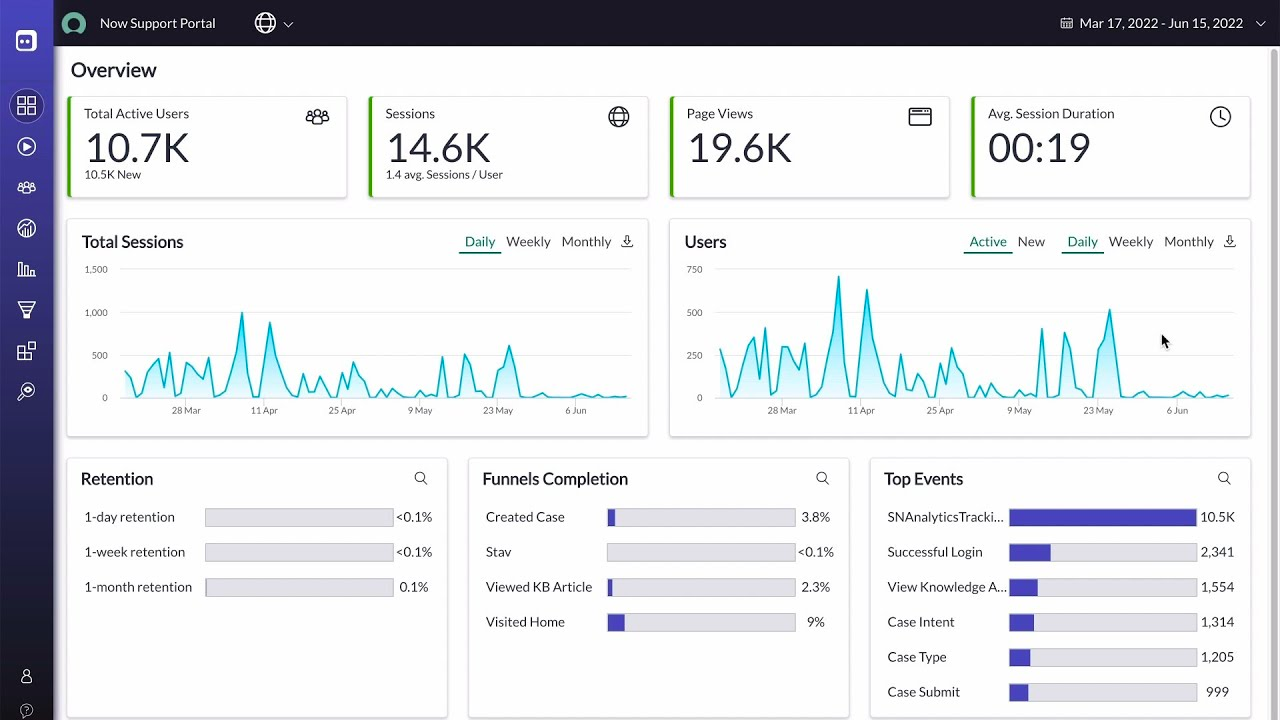
With user experience analytics tools, businesses can track metrics like page views, clicks, conversion rates, bounce rates, and average session duration.
These tools offer visualization capabilities, presenting analytics metrics data in the form of charts, graphs, and dashboards, making it easier to understand and interpret.
Behavior analytics tools also provide advanced capabilities like A/B testing, heatmaps, session recording, and user journey mapping.
These features help businesses uncover insights into user preferences, pain points, and opportunities for customer experience improvement.
Popular user analytics tools in the market include Google Analytics 4 (formerly Universal Analytics), Mixpanel, Amplitude, and Heap Analytics.
These tools offer a range of functionalities to cater to the diverse needs of businesses and feature simple dashboard solutions for streamlined user behavior analysis.
One particular type of user analytics tool that helps see the big picture is customer journey analytics, which breaks down the entire sequence of steps from end to end.

By leveraging behavior analytics tools, businesses can make data-backed decisions, optimize user experiences, and drive growth.
And in the long run, these tools empower organizations to understand their users at a granular level and continuously refine their strategies to meet user expectations in an increasingly competitive digital landscape.
Examples of User Analytics
Example 1: User Analytics in E-commerce
User analytics in e-commerce provides valuable insights into customer behavior and preferences, helping businesses optimize their online shopping experiences both for unique users and users as a whole.
By analyzing user dashboard data, an e-commerce product team can understand which products are popular, how users navigate their websites, and what factors influence purchasing decisions.
For instance, user analytics can reveal that a significant number of users abandon their shopping carts at the payment stage.
Equipped with this insight, businesses can investigate the reasons behind the drop-off and implement strategies to streamline the checkout process, such as simplifying the payment options or addressing any security threat detection concerns.
Additionally, user analytics can identify high-value customer segments based on factors like purchase history, average order value, or engagement with promotions.
This information enables businesses to perform user research, create personalized marketing campaigns, recommend relevant products, and improve customer retention.
By leveraging data collection through behavior analytics, e-commerce businesses can optimize their inventory management, identify trends, and forecast demand more accurately.
This data-driven approach allows companies to make informed decisions on pricing, stock levels, and product assortment, resulting in improved customer satisfaction and increased revenue.
Put this all together, and it’s easy to see why user analytics is such an integral part of customer journey management.
Example 2: User Analytics in Mobile Apps
A user analytics tool in mobile apps helps app developers understand user behavior, engagement patterns, and areas for improvement.
Through user analytics, developers can track metrics like app downloads, session duration, screen flow, and user retention.
For example, user analytics can reveal that a particular feature of the app is underutilized or confusing to users.
Armed with this insight, developers can refine the feature or provide in-app tutorials to enhance user understanding and engagement.
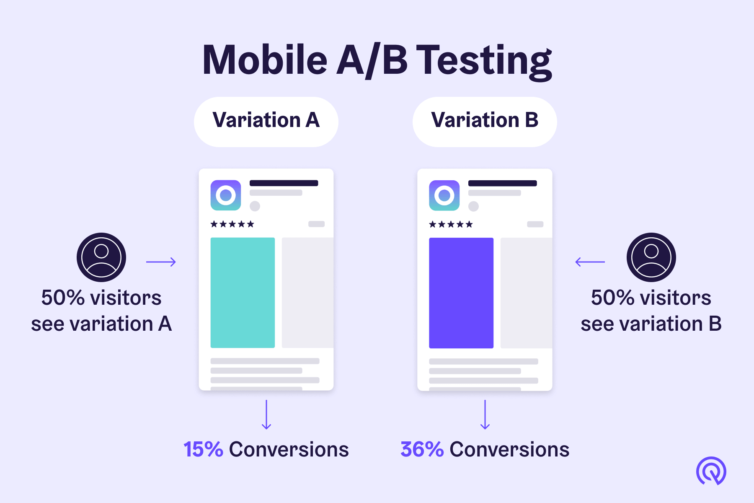
User analytics can also assist in A/B testing, where different variations of app features or layouts are presented to different user groups.
By comparing user behavior and metrics between the groups, developers can determine which variation performs better and make data-driven decisions to optimize the app's design.
 Source: App Radar
Furthermore, user analytics can help identify drop-off points, such as when users abandon the user onboarding process or exit the app after a few sessions.
Developers can use this information to identify friction points and make improvements to enhance user retention and satisfaction.
And with User ID (or client ID), they can track the behavior of a Google Analytics user on a dashboard even if they use different devices or browsers.
By leveraging user analytics, mobile app developers can create better user experiences, increase engagement, and drive app downloads and ratings.
It also allows developers to iterate and refine their apps based on real user data, resulting in improved app performance and user satisfaction.
Example 3: User Analytics in Content Websites
User analytics in content websites provides insights into user interaction, content preferences, and traffic sources.
Content websites can track metrics like page views, time on page, bounce rates, and popular content categories to understand user interests and behavior.
For instance, user analytics can identify that certain types of articles or topics have high engagement rates, while others perform poorly.
This data allows content creators to focus on producing more content that resonates with their audience and improves overall user satisfaction.
User analytics can also help content websites optimize their monetization strategies.
By tracking user behavior, such as clicks from Google Ads or conversions, websites can identify the most effective ad placements and formats.

This information enables websites to generate more revenue while maintaining a positive user experience.
Furthermore, user analytics can reveal the traffic sources that drive the most engaged users to the website.
Whether it's organic search, social media, referral links, or traffic from a related article, understanding these sources allows websites to allocate resources and optimize their marketing efforts accordingly.
If you’re looking to learn how to make marketing a profit center with customer journey analytics, the data gained through this technology can be instrumental in doing so.
By leveraging a user analytics tool, content websites can deliver more relevant and engaging content, enhance their revenue generation, and improve their overall user experience.
In the long run, user analytics empowers content creators to make data-driven decisions that maximize active user engagement and drive website growth.
Wrapping Up
In conclusion, user analytics is a powerful tool that provides businesses with valuable insights into user behavior, preferences, and trends.
Whether in e-commerce, mobile apps, or content websites, user analytics enables businesses to improve research methods, make data-driven decisions, optimize user experiences, and drive growth.
By leveraging the wealth of information provided by user analytics, organizations can stay ahead of the competition and deliver exceptional experiences that resonate with their users.


