Acquiring new customers is obviously important. But retaining existing customers and maximizing their lifetime value is equally critical to long-term success.
Figuring out what’s contributing to churn along with the factors that contribute to customer success is the first step in increasing retention.
That’s where customer retention analytics comes in.
What is Customer Retention Analytics?
It uses data to analyze customer behavior to identify what factors are 1) creating churn and 2) leading to loyalty and satisfaction.
The primary purpose of customer retention analytics is to gain a clear understanding of which specific issues are causing churn so you can take steps to lower it.
At the same time, customer retention analytics also helps you understand the areas where you’re succeeding.
It’s all about taking a big-picture approach to user retention so that you base your decision-making on objective, quantifiable data rather than merely intuition.
Given that “acquiring new customers is five times more expensive than retaining existing customers,” and “there’s a 60-70% chance of selling to an existing customer,” you can see why businesses across many industries are eager to leverage customer retention analytics.
This is especially true where user retention is the lifeblood of a company’s success, with SaaS being a prime example.
Why is Customer Retention Analytics Important?
It’s simple. Maximizing customer retention keeps existing customers around longer, which offers a plethora of benefits.
As we just mentioned, it’s way more cost-effective to retain current customers than to acquire new ones.
Once you’ve moved customers through the sales funnel and gotten them to make a purchase, you can continue to nurture them and strengthen relationships, which often translates into additional sales.
Also, retained customers tend to spend more on purchases than new customers.
For perspective, research has found that increasing customer retention by just 5% can boost revenue by 25-95%.
You can also increase your average customer lifetime value.
Instead of constantly spending time and money on new customer acquisition, increasing user retention means users hang around for longer, which also adds to your profitability.
Besides that, companies with strong customer retention tend to have more brand advocates, see greater brand loyalty, and get more word-of-mouth referrals than those with weak customer retention.
And this makes sense. Customers who stick with you tend to be more loyal and will naturally want to promote your brand, creating a cycle.
The bottom line is that having a solid retention strategy is vital, and retention analysis is the first step in the process.
When combined with other types of analytics like customer loyalty analytics and marketing analytics, you can really get your brand firing on all cylinders.
How Do You Measure Customer Retention?
To measure user retention, you’ll need a customer analytics tool that focuses specifically on retention analysis.
A key part of Woopra customer journey analytics, for instance, is the Retention Analytics Reports, which provide a detailed overview of virtually every aspect of customer retention.
 With Retention Analytics Reports, you can monitor customer retention end-to-end to see exactly what your retention and churn rate is, what factors are contributing to churn, and what you’re doing right so you can keep doing it.
For example, you can use customer retention data to see what percentage of customers return after making an in-app purchase.
 You can use this form of customer data analytics to see what percentage of users return after using a core product feature.
 You can also see what your customer retention rate is specifically for mobile users.
 And that’s just the tip of the iceberg. A customer retention analysis tool can provide data on nearly every aspect of customer behavior you want to know.
It’s also worth mentioning that 44% of today’s companies focus on customer acquisition. However, only 18% focus on customer retention.
This means if you’re one of the businesses that uses customer retention analytics, you should have a competitive advantage by default.
Popular Customer Retention KPIs and Metrics
There is a wide array of retention metrics that can be used to understand customer behavior, but here are six of the most popular.
- Customer retention rate - The most fundamental of retention metrics, this measures the percentage of customers that remain with your business over time. Customer retention rate varies by industry, but studies have found that it averages out at around 72.5% across the board.
- Churn rate - This is the other core KPI and measures the percentage of customers that are lost over a specified period.
- Repeat purchase rate - This is the percentage of existing customers that make at least one additional purchase during a specified period. Measuring repeat purchase rate is beneficial because it provides insight into customer satisfaction and loyalty.
- Customer Satisfaction Score - This measures how satisfied customers are with a company and typically looks at a percentage ranging from 0% being the worst to 100% being the best. Generally speaking, scores between 75 to 85 are considered good.
- Net Promoter Score - Generating a Net Promoter Score (NPS) is done by asking the question, “How likely are you to recommend our product/service to others?” This lets you know what percentage of your customers are detractors, passives, and promoters, where promoters are far more likely to stick with your company for the long haul. Some will even promote your brand via word-of-mouth and become brand advocates.
- Customer lifetime value - This is the total value a customer brings to your business throughout the entirety of your relationship. Again, customer loyalty factors heavily here. When you have a large customer base of loyal individuals, it should raise your customer lifetime value.
There are, of course, other retention KPIs and customer metrics, but these tend to serve as a good starting point and should provide you with the core information you need to assess your customer base.
Types of Customer Retention Analytics
Going further, you can break customer retention analytics down into three main categories.
Descriptive analytics analyzes historical data to understand trends and patterns relating to customer retention. This should provide a clear understanding of what strategies are and are not working so you can make the appropriate changes.
Using descriptive analytics is a good way to get a baseline reading of the current state of your customer retention.
Predictive analytics uses models to forecast customer behavior in the future accurately. If, for instance, customer data predicts that your retention rate is going to drop in an upcoming quarter, you could take proactive measures to reduce the chances of that happening.
And prescriptive analytics leverages data to determine what you can do to improve your product, service, customer experience, and so on to ensure the best outcome.
Say that through prescriptive analytics you determined that enhancing a particular product feature would increase your odds of boosting customer retention. That would be a specific area you would want to focus on in your customer retention strategy.
How to Use Analytics to Reduce Customer Churn
Now that we know the ins and outs of customer retention analysis, let’s discuss some practical ways to put it to use.
1. Understand When You’re Losing Customers and Who They Are
One of the first things you’ll want to understand is what specific factors are causing customers to churn.
Maybe it’s a poor user experience. Maybe your onboarding process is inefficient. Maybe it’s poor customer service.
Whatever the case, churn reports allow you to diagnose exactly when you’re losing customers and who they are.
From there, you can begin to take measures to resolve pressing problems and lower customer churn to prevent similar issues from happening in the future.
If you discover that your current customer service is lackluster, you would want to make that a top priority to get things back on track.
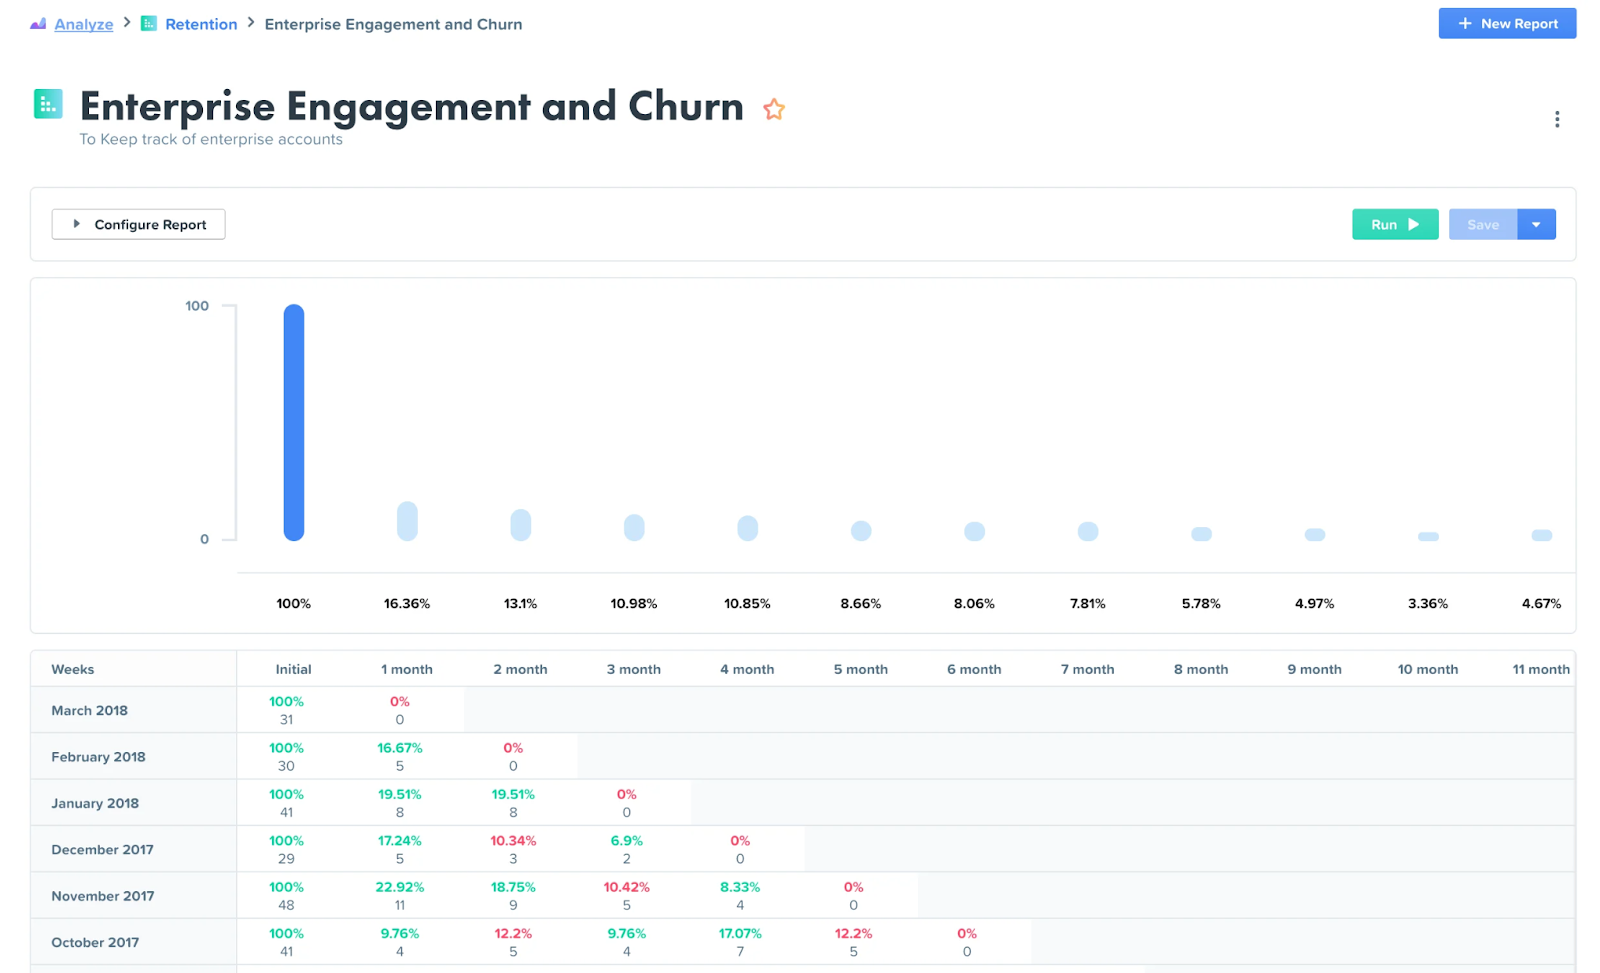
Here’s what a churn report may look like for an enterprise company that wants to see how churn increases over the course of 12 months.
 By looking at a report like this, you can accurately gauge when you’re seeing a normal customer churn rate or when it’s above average. From there, you can take a deeper dive into customer retention metrics to unearth which specific types of customers you’re losing.
If, for example, mobile users are the main customer segment that’s leaving prematurely, you may want to create a loyalty program that specifically targets them or get customer feedback from mobile users to find out what’s causing friction.
2. Pinpoint Who Your Loyal Customers Are and How to Retain Them
Besides figuring out why customers leave, retention analysis also helps you identify who your loyal customers are and how you can keep them coming back.
Once you understand what’s contributing to someone becoming a loyal customer, you’ll be better positioned to double down on what’s working. That way, you can instill even more loyalty and continue to strengthen existing relationships.
This can be done by analyzing retention analytics reports to monitor actions like logging in on mobile devices and using core product features to fully understand who your best customer types are and how to better cater to them moving forward.
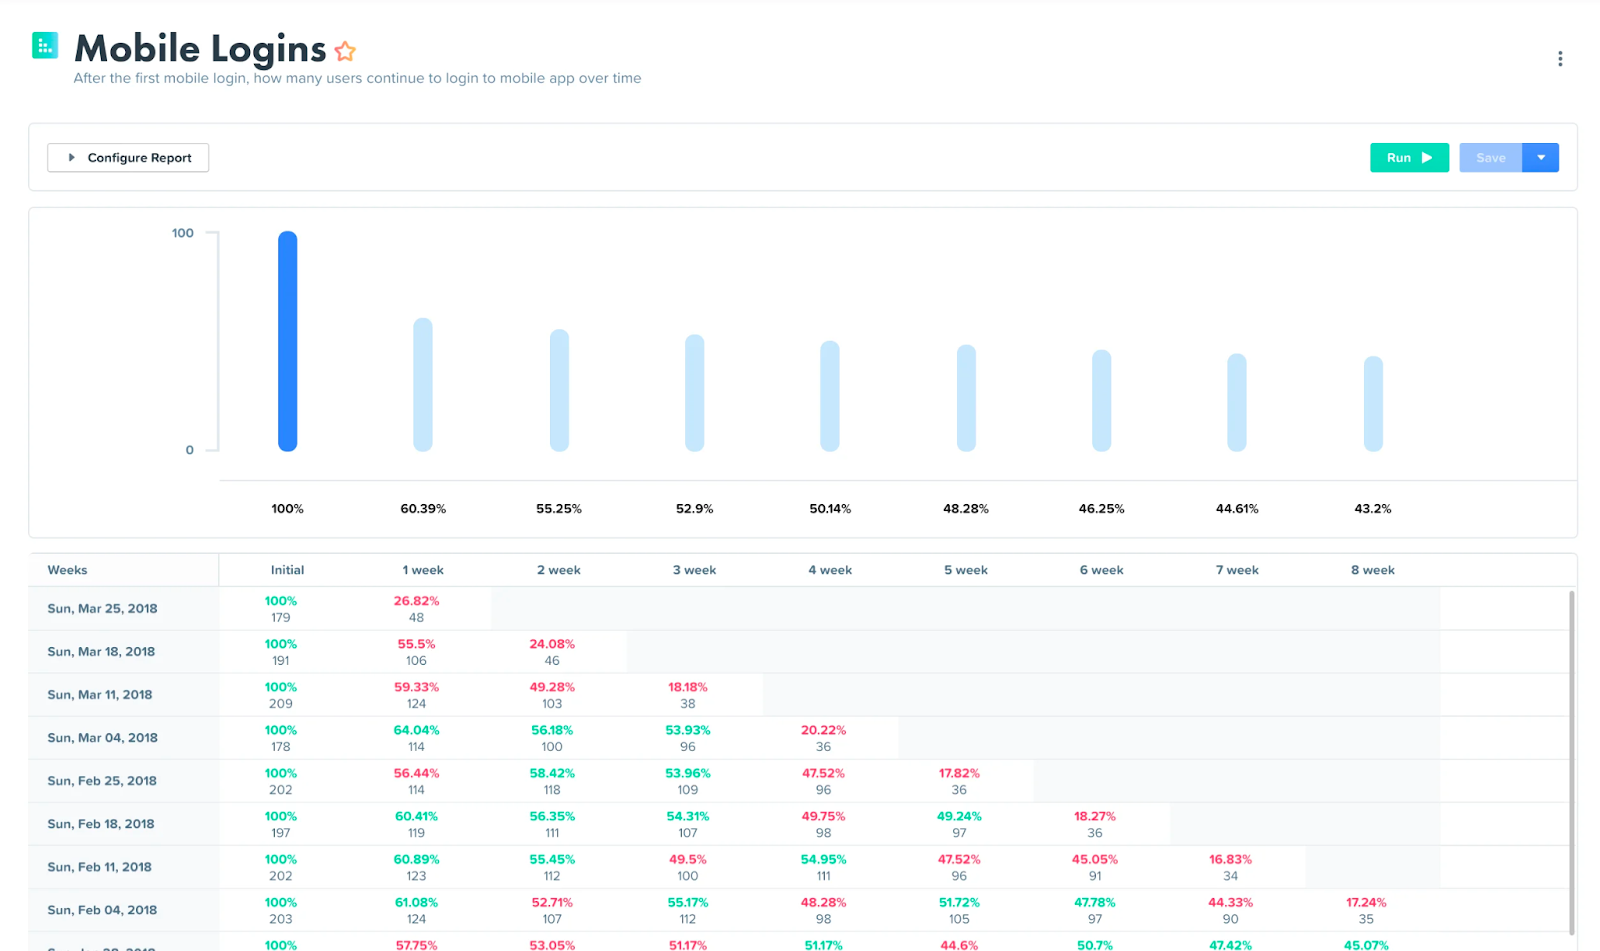
Here’s what a mobile logins retention analysis report looks like where you can see how the number of mobile users logging in diminishes over time.
 If the numbers on this report look less than healthy, you would want to focus specifically on the mobile side of things rather than the desktop. This could include enhancing the mobile UX or providing mobile users with a clear path to customer service when they run into issues.
That way they could quickly get back on track and keep using your product consistently. In turn, this should naturally help improve your customer retention over time.
3. See How Different Behavioral Segments of Customers Engage with Your Product
Just as segmentation is critical for many other areas of customer analysis, it also plays a key role in retention analysis.
More specifically, it’s helpful to assess how different behavioral segments use and interact with your product.
An example could be determining if, on average, customers who purchased after a drip campaign remained with you for longer than customers who purchased after viewing social media ads.
Or, you might see if customers who primarily use your product on a desktop are more likely to stick around longer than those who primarily use it on a mobile device.
With this retention report, you can go more granular and view each segment individually, as well as see how everything fits together to enhance your overall retention efforts.
4. Identify At-Risk Customers
Generally speaking, there’s a correlation between product usage and churn risk.
For instance, if customer A uses your product nearly every day and consistently engages with its core features and customer B only uses your product once a week, odds are you would have a better chance of retaining customer A.
Therefore, an effective way to lower your customer churn rate is by identifying at-risk customers before they leave.
By doing so, you can prioritize at-risk customer needs to boost engagement and increase their satisfaction rate.
A couple of specific ideas could be sending at-risk customers resources on how to get more value from your product or appointing them a specific point of contact whom they can reach out to if they have questions about using your product.
The end result should be less frustration and confusion for your customers, which should factor into them staying with your company longer.
5. See What Percentage of Users Return After Using a Core Product Feature
Let’s say your product has a core feature that you want to stand out above the rest.
Or, let’s say you recently rolled out a new feature, and you want to see how well it performs and the impact it has on retention.
One specific area of customer retention analysis to assess would be what percentage of users return after using that core feature.
 By analyzing that data, you could determine how successful the product feature is and if it needs any tweaking.
Or, if it completely bombed and was hurting retention, you may want to replace it altogether.
6. Find Out How Many Users Return to Make an In-App Purchase
A big part of many SaaS business models is offering a free version of a product.
This allows companies to get their foot in the door so users can try their product firsthand, explore features, and hopefully upgrade to a paid version later on.
If you fall into this camp, an important part of retention analysis is measuring how many users return to make an in-app purchase.
 Ideally, a healthy percentage of users will return and make a purchase.
Otherwise, if that percentage is lower than what it should be, you can take steps to improve your product, marketing campaign, and so on to improve customer engagement.
And in the long run, this should hopefully optimize the customer experience and positively impact retention.
7. See How Many Users Open Emails
In most cases, there’s a correlation between email engagement and customer retention.
When a customer consistently opens onboarding emails or feature usage emails, for instance, they’re likely to use your product more frequently and fully leverage its capabilities than if they rarely open your emails.
Therefore, checking what percentage of users continue to open emails over time can also provide insight into customer retention.
In this example, you can see how the percentage of emails is high initially but quickly drops off after the first week.

Use Woopra for Customer Retention Analytics
Again, having effective processes in place that allow you to increase initial customer acquisition is important. But it’s only half the battle.
True long-term success largely hinges upon customer retention and lowering revenue churn, especially in the SaaS industry.
In fact, “76% of companies agree that customer lifetime value is an important concept in their organization.”
To make data-driven decisions and see the big picture, you need customer retention analytics that offers holistic data.
One of the top platforms for measuring engagement of features and actions over time is Woopra’s Retention Analytics Reports.
With it, you can generate the data we discussed above and gain a comprehensive understanding of customer engagement end-to-end.
In turn, you can proactively minimize churn, while at the same time identifying the factors that are contributing to retention and overall customer success.
To learn more and see this retention analysis platform in action, check out Woopra’s Retention Analytics Reports.


